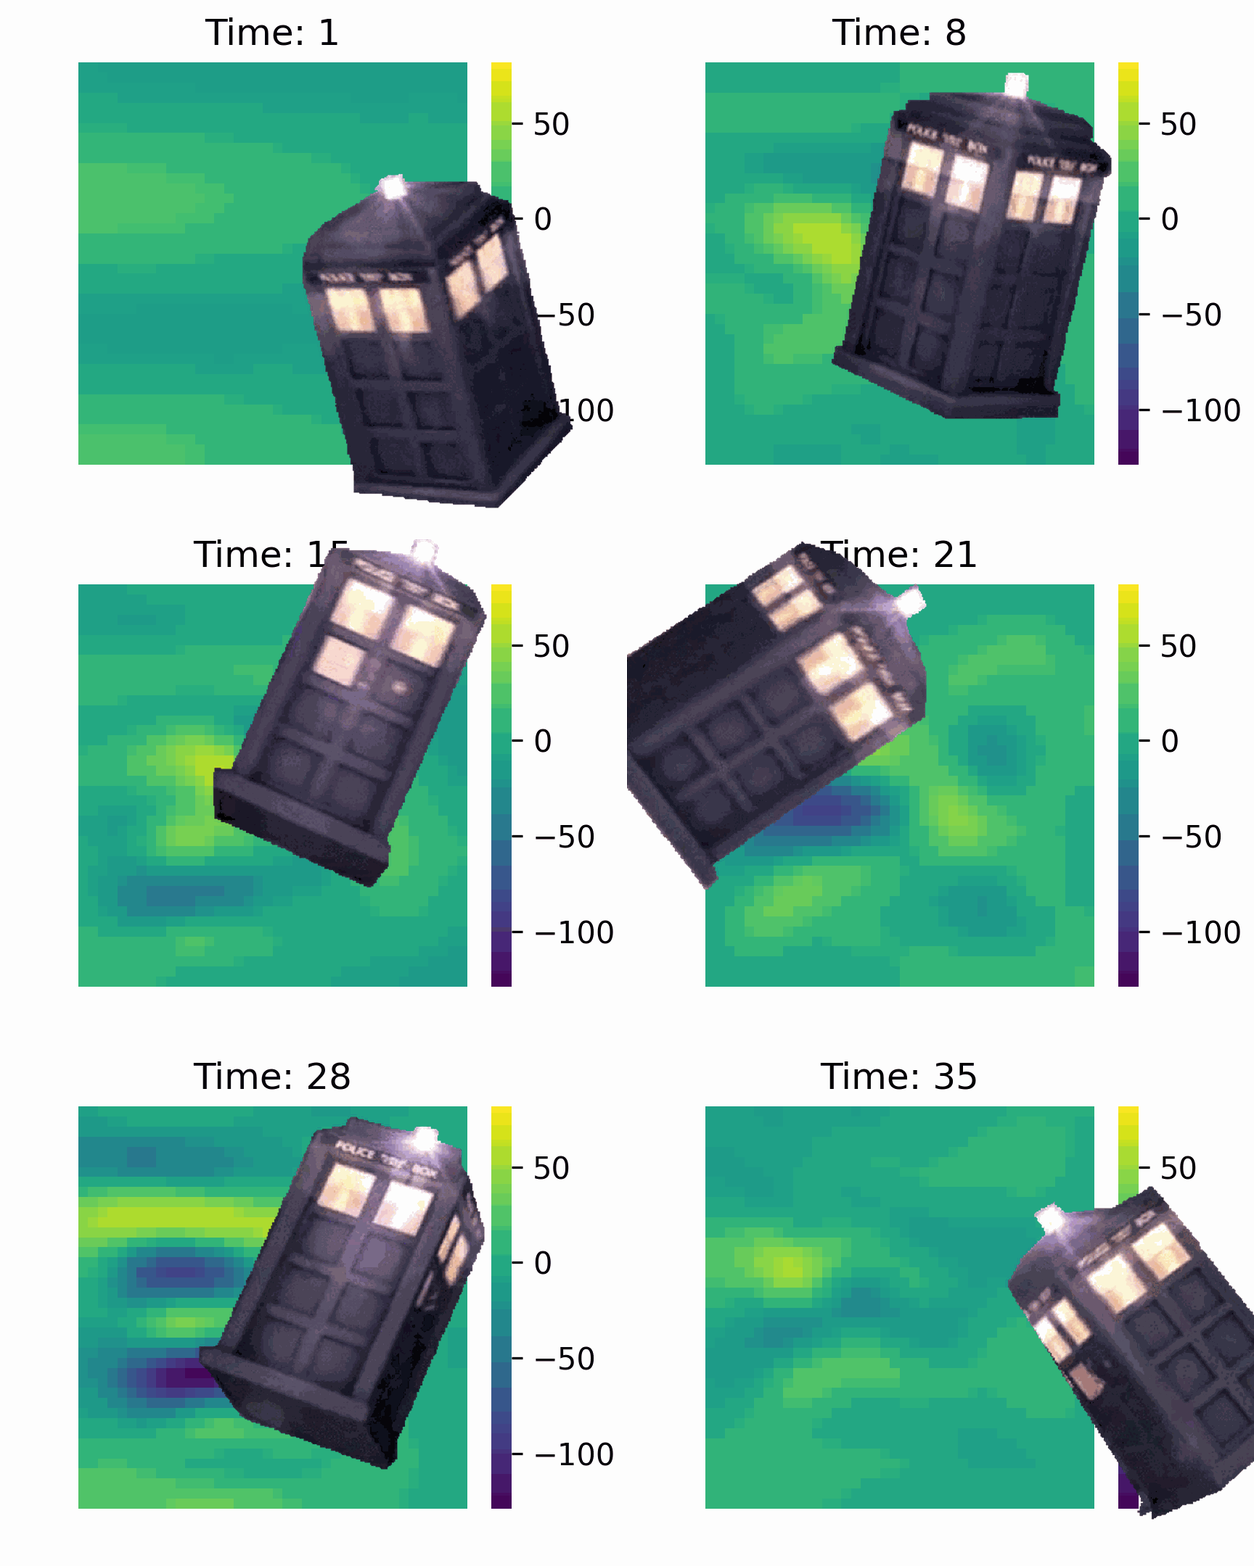
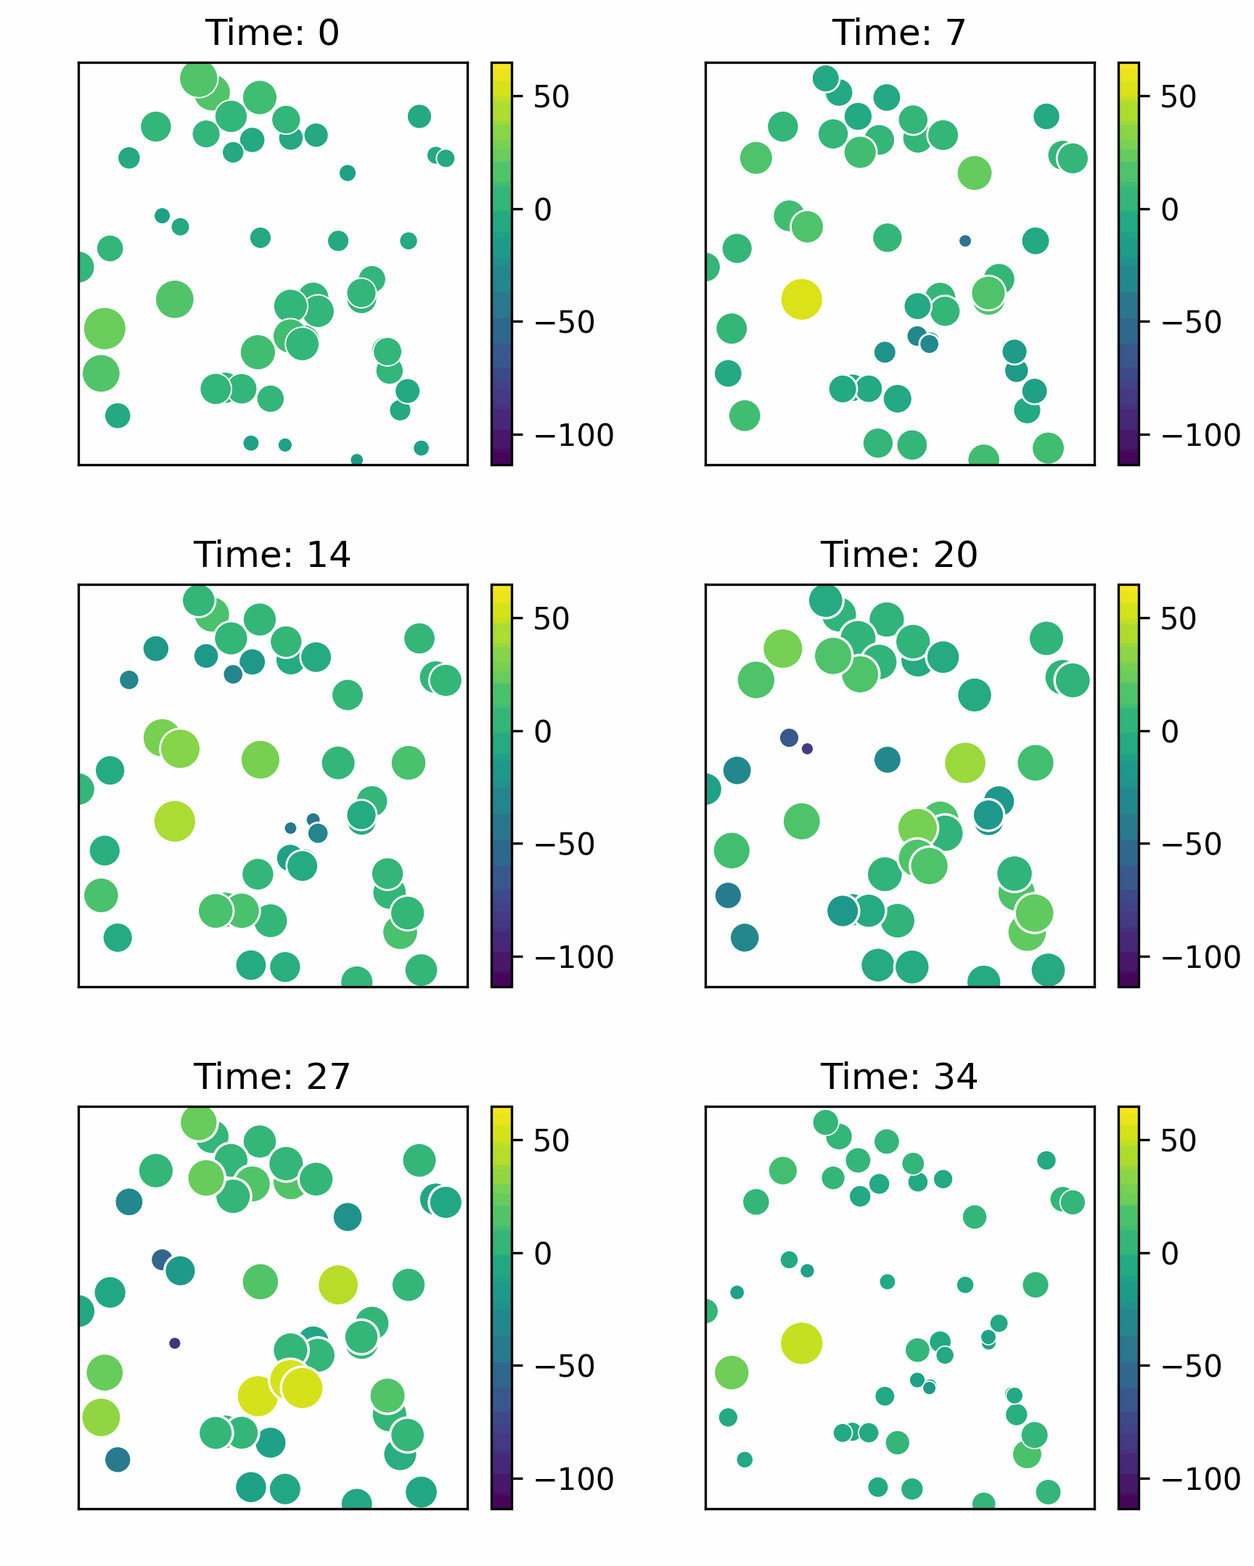
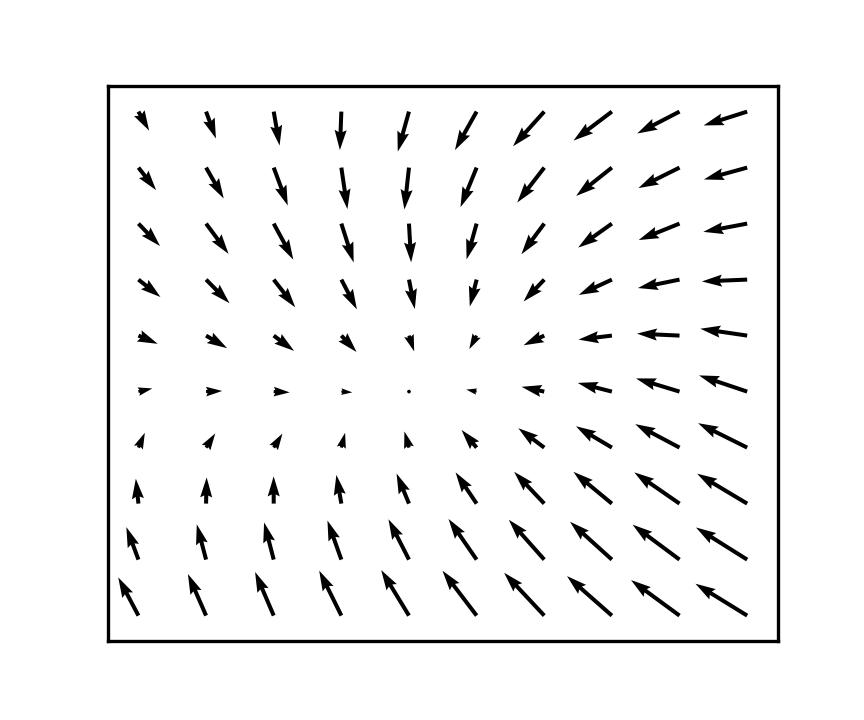
import jaximport osimport jax.numpy as jnpimport jaxidem.utils as utilsimport jaxidem.idem as idemimport matplotlib.pyplot as pltfrom PIL import Image, ImageSequence= 4 = jax.random.PRNGKey(seed)= jax.random.split(key, 10 )= utils.place_cosine_basis(N = 10 )#process_basis = utils.place_basis() = jnp.diag((0.01 * jnp.ones(process_basis.nbasis)).at[1 ].set (40.0 ).at[30 ].set (80.0 ).at[31 ].set (60.0 ))#sigma2_eta = 0.01 = ['Intercept' , 'x' , 'y' ]= idem.gen_example_idem(keys[0 ], k_spat_inv= False , ngrid= jnp.array([40 , 40 ]), process_basis = process_basis, sigma2_eta = sigma2_eta, covariate_labels= covariate_labels)# Simulation = 35 = 50 = jax.random.uniform(0 ],= (nobs, 2 ),= 0 ,= 1 ,= jnp.repeat(jnp.arange(1 , T + 1 ), coords.shape[0 ])= jnp.tile(coords, (T, 1 ))= rep_coords[:,0 ]= rep_coords[:,1 ]= model.simulate(keys[1 ], x, y, times,= jnp.column_stack([x,y]))= 200 = 576 / dpi= 480 / dpi# plot the objects "site/figure/process.gif" , width= width, height= height)"site/figure/obs.gif" , width= width, height= height)"site/figure/kernel.png" , width= width, height= height)= Image.open ('site/figure/process.gif' )= Image.open ('site/figure/tardis.gif' )= gif1.size= []= len (list (ImageSequence.Iterator(gif1)))= len (list (ImageSequence.Iterator(gif2)))= max (num_frames_gif1, num_frames_gif2)for i in range (max_frames):= ImageSequence.Iterator(gif1)[i % num_frames_gif1].convert("RGBA" )= ImageSequence.Iterator(gif2)[i % num_frames_gif2].convert("RGBA" )= frame2.resize((width, height), Image.LANCZOS)= Image.alpha_composite(frame1, frame2)0 ].save('site/figure/process.gif' , save_all= True , append_images= frames[1 :], duration= gif1.info['duration' ], loop= 0 )

